2700 visitors and a hat to help the blind see: hubraum visits MWC 2024
After a whirlwind trip to the 2024 Mobile World Congress in Barcelona, we’re ready to celebrate our wins.
Javier Marti has worked at institutions like the European Space Agency, the National Ecological Observatory Network and the European Southern Observatory. He is now the CEO of divirod Inc., a startup building the world’s most comprehensive data lake to map, manage and predict water risks. Given his big data expertise, we asked him for ways to think more rigorously about a subject that’s often deployed as a buzzword. In response, he devised five questions to help you think more clearly about the data you have, what you’re using it for, and how to make it more accessible.
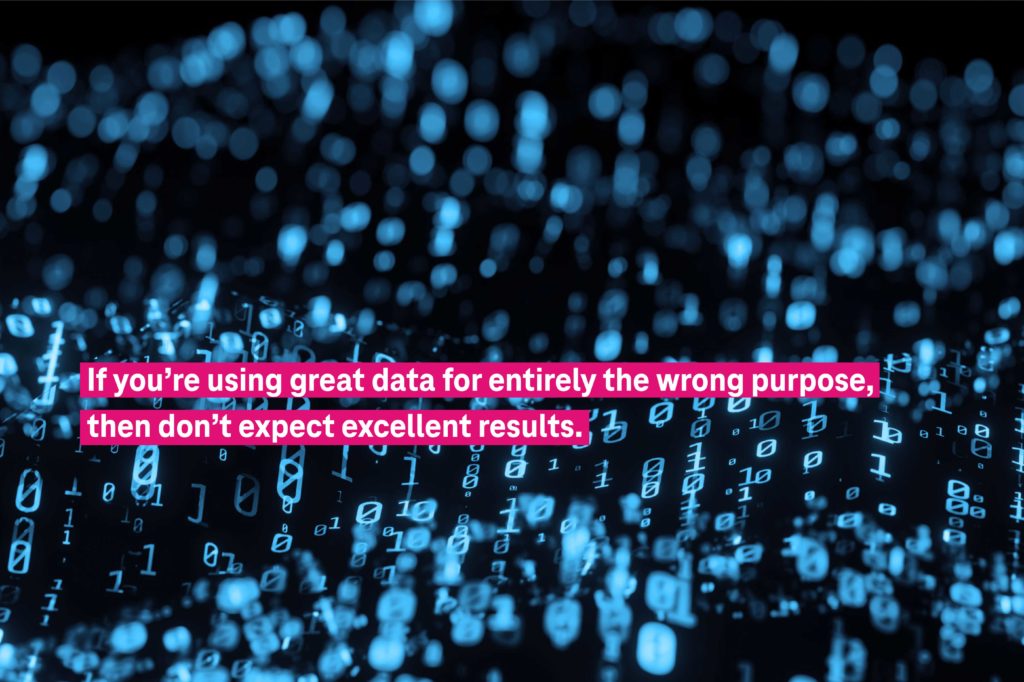
‘Big data’ shouldn’t be confused with huge amounts of data being smashed into some sort of model to reach a certain outcome. Make sure you’re smart about using data. If you’re using great data for entirely the wrong purpose, then don’t expect excellent results. For example, if I take the results of a survey conducted in Europe to reach conclusions about the US market, those conclusions are going to be completely wrong.
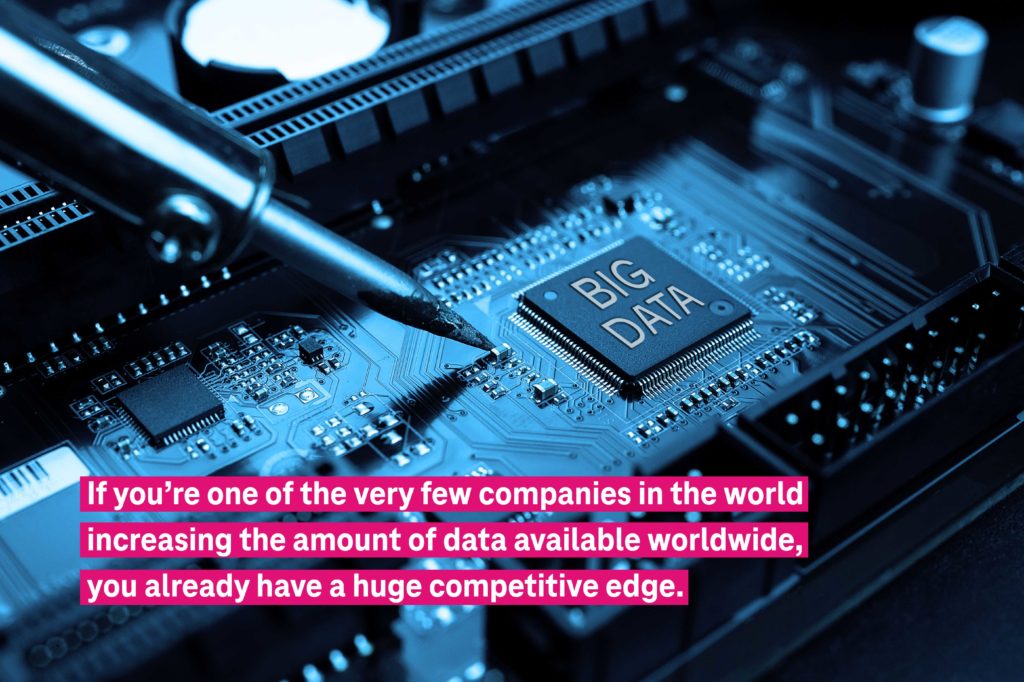
By “competitive”, I mean — how many people have used them before? New datasets are very valuable, but difficult to find. If you look into this sector, where do we get data from? Especially when making observations like Divirod does about water, most of the time, data comes from a few select sources: largely, governments. Most of the time, the government doesn’t have the infrastructure to develop more datasets than the ones they already offer. So if you’re one of the very few companies in the world actually increasing the amount of data available worldwide, you already have a huge competitive edge. Then look at what you’re offering people: if you’re not replicating the data that’s already out there, if it’s new data which offers new insights, that’s immensely valuable.
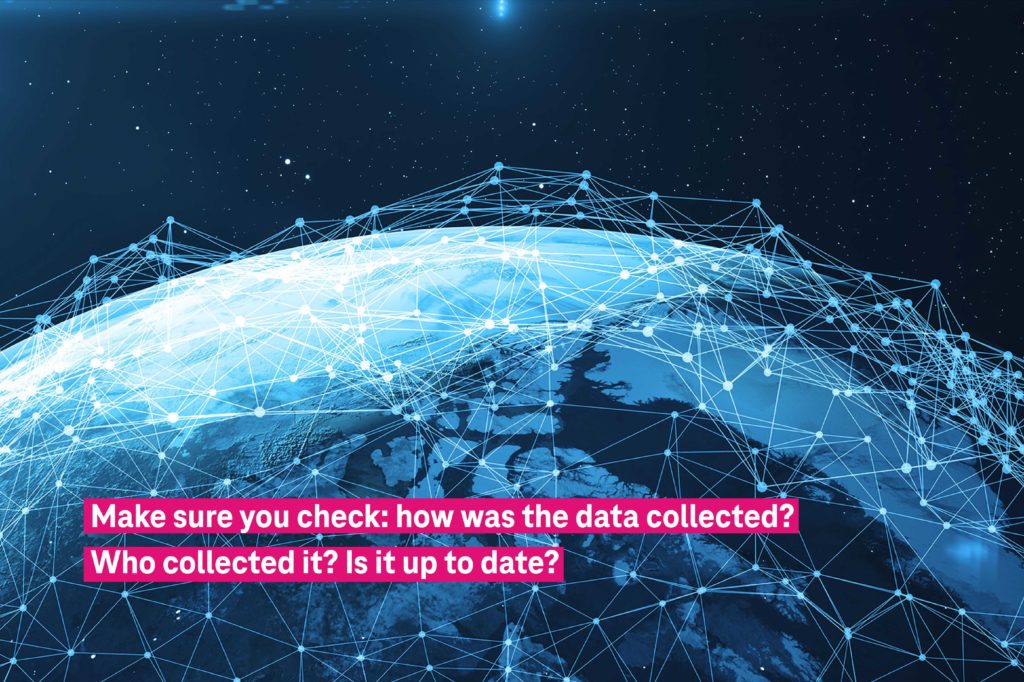
Big data isn’t just about quantity, but quality. Not all data is good, and if you use bad data, expect bad results. By bad data, I’m talking about figures where you don’t know the source of the data; you’re not sure how the data was collected, so you’re in the dark as to the quality of data. So make sure you check: how was the data collected? Who collected it? Can you verify any small part of it to ensure it’s trustworthy? Is it up to date? The more effort can be deployed into improving data quality, the more valuable the outcomes become.
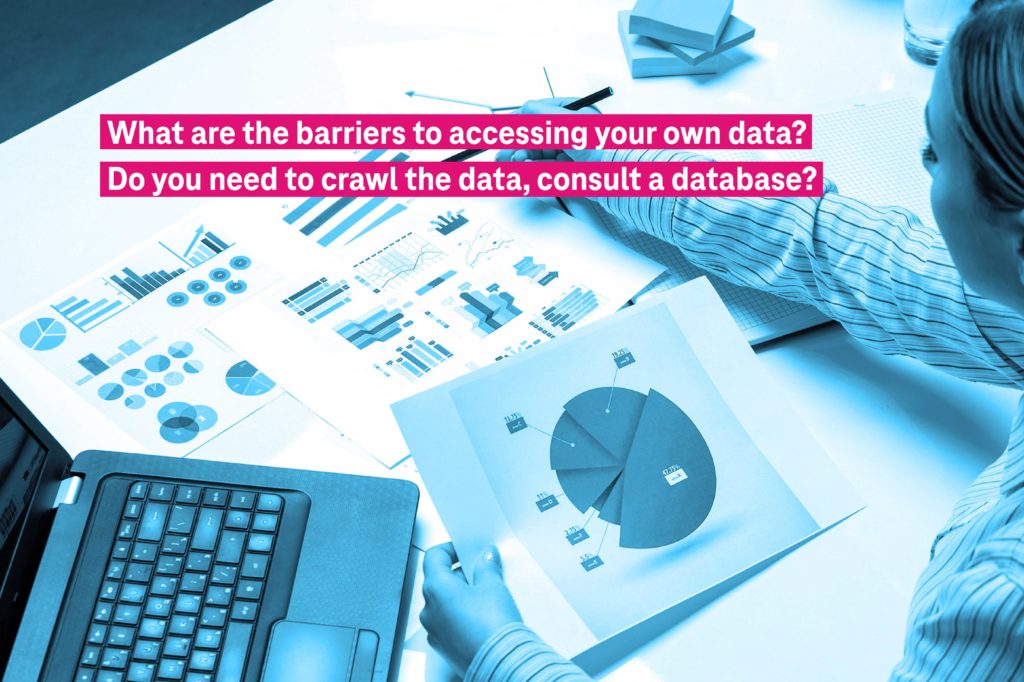
Assuming you already have a data-based product, what are the barriers to accessing your own data? Do you need to crawl the data, consult a database, take the time to understand what you’re reading or is the data being provided to you in a way that you can consume it very easily? The more easily you present data to users, the easier it is to use. Look at NASA – they have lots and lots of data. But it’s difficult to actually use that data — you need to study data management and engineering before you can actually access it.
On a related topic, visualization is a key component of working with big data. It has to be used carefully, since it influences people to think in a certain way. So if I put in big capital letters that you have one foot of water at your door and it’s in red and flashing, that creates a sense of urgency. Imagine the same message, but it’s visualized without flashing or red font, and it’s shown in a picture of a bucket. This will give you the sense it’s not harmful to you. If you’re interested in this topic, I’d really recommend reading Edward Tufte’s The Visual Display of Quantative Information.